No training on your data
Your transactions, assumptions, and models are never used to train shared models or improve the product for other customers.
Skip opaque templates. Pellucid sets up a driver-based model for your business through a clarifying conversation, then generates Profit & Loss, Cash Flow and Balance Sheet outputs you can explain; and that investors can audit with the Excel tools they already trust.
Pellucid Forecasting works inside your Excel workbook. We help you set up drivers, rates, and the outputs you need; we do not train on your data, keep a copy of it, or treat your numbers as ours.
Your transactions, assumptions, and models are never used to train shared models or improve the product for other customers.
We do not retain a copy of your spreadsheet on our servers. What you enter stays in your workbook unless you choose to share it with us directly.
Our role is to help you structure the model and produce the forecasts you need. You stay in control of the file and the results.
Forecasting works best when you can explain every number. Keeping your data local and under your ownership is part of that promise.
For full details on how we handle personal information, see our Privacy Policy.
How it works
Pellucid’s AI asks for the driver details that matter—then builds drivers, rates, and a linked forecast in Excel you can explain.
You
We operate a climbing gym with memberships and casual visitors.
Pellucid
Got it. A few driver details so I can build the model:
Professional forecast
Profit & Loss, Cash Flow, and Balance Sheet—linked so one change updates the whole model.
Use case
A worked example for an independent car wash. You run the site in vehicles through the bay and price per wash; Pellucid structures that into drivers, rates, and financial statements in Excel.
Driver
Cars washed
What moves when you add a bay, extend hours, or a membership plan brings more volume.
Rates
Revenue per wash
Average price per wash turns volume into revenue and profit you can explain.
Scenario to test
+12% cars washed, −1 pt margin
A second bay lifts throughput; chemicals and labour squeeze margin. Change the driver and see income statement and cash flow update in the same workbook.
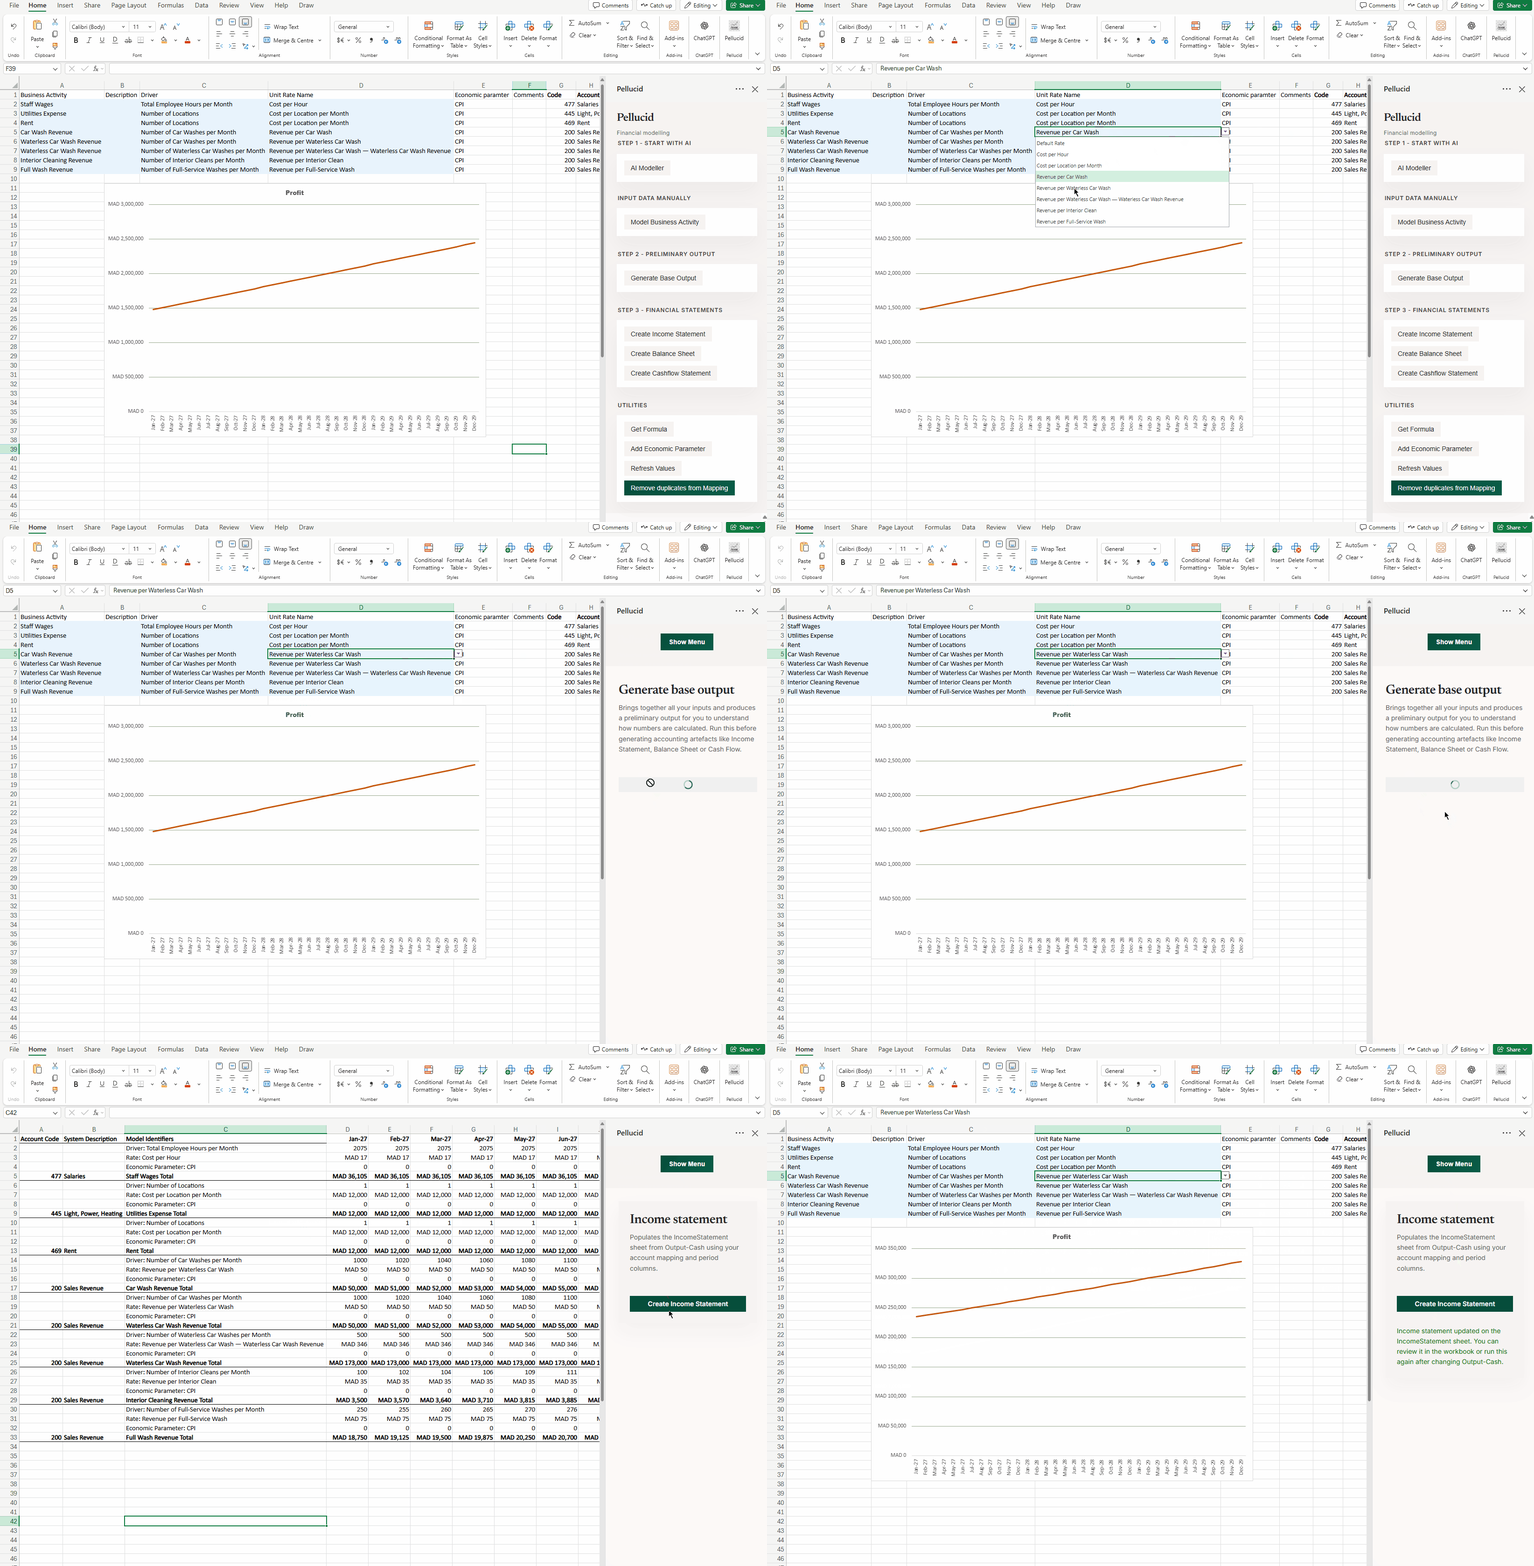
You stay in Excel. Pellucid upgrades how the model is built and kept in sync.
| Excel | Pellucid |
|---|---|
| Manual formulas | AI-assisted modelling |
| Broken links | Driver-based models |
| Difficult to update | One change updates everything |
| Separate statements | Integrated 3-way forecasting |
Start free
Add Pellucid Forecasting from inside Excel, then work directly in your workbook. The add in connects analysis to drivers and rates.
For screenshots and a printable style walkthrough, see the user guide.
Get early access notes, tips, and product updates as Pellucid Forecasting evolves.
Ready to try it now? Start free from Excel, or see Support / admin@8bits.company.