
Guide
Pellucid is an Excel add-in for financial forecasting. Describe your business in conversation with the AI Modeller, review the data it creates in your workbook, and when you are ready ask it to build the model. After that, refine assumptions in Excel or through further chat, and use Refresh values to update your outputs.
Before you start
You need:
- Microsoft Excel (Office 2021 or Microsoft 365)
- An internet connection (for the AI assistant)
- The Pellucid add-in installed in Excel
Install the add-in
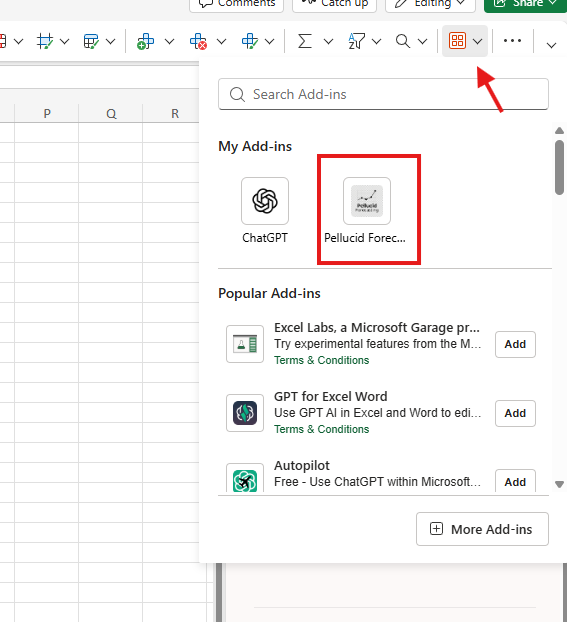
Add Pellucid from inside Excel using the Add-ins flow. Your tenant controls what is allowed, so if the add-in is unavailable, ask your Microsoft 365 admin.
From Excel (Insert → Add-ins)
- Open Excel (desktop or web, depending on what your licence supports).
- Go to Insert, then Add-ins, then Get Add-ins (labels can vary slightly by version).
- Search for Pellucid Forecasting, open it, then choose Add or Continue and finish the prompts.
Step 1 — Open Pellucid
- Open Excel (new or existing workbook).
- Go to the Home tab.
- In the Pellucid group, click Pellucid.
- The task pane opens on the right with “Pellucid — Financial modelling”.
The default screen is AI Modeller.
Step 2 — Set up the model
Set up your model by having a conversation with the AI Modeller. The AI turns what you describe into structured data that the model uses.
Have the conversation
- Open AI Modeller in the task pane.
-
Describe your business in plain language — what you sell, your main costs, one-off investments, and how far
ahead you want to forecast. For example:
“We operate a physical electronics retail store selling smartphones, laptops, and warranties. Revenue comes from in-store sales. Main costs are COGS, wages, rent, utilities, and marketing. I also spent $300k on POS devices.”
-
When asked, provide:
- Break Forecast by — Weeks, Months, or Years
- Number of periods — e.g. 36 for 3 years monthly
- Start date
- Reporting currency — any currency you use for the model (e.g. USD, AUD, EUR, GBP, INR, JPY, CAD)
The AI converts this conversation into data written into your workbook — forecast settings, business activities, drivers, rates, mapping, and related inputs.
Check and adjust the data
Before modelling, review what the AI has created. Open the relevant workbook sheets and confirm the data looks right:
| Sheet | What to check |
|---|---|
| ModelSetupDetails | Break Forecast by, number of periods, start date, reporting currency, business overview, and line items identified |
| Drivers | Quantities and units (e.g. units sold, headcount) |
| Rates | Dollar values per unit (e.g. $/unit, $/month) |
| Mapping | How each business activity links to a driver, rate, payment terms, and accounts — read Comments for AI rationale |
| EconomicParam | Growth or inflation assumptions, if any |
Adjust anything that is wrong or incomplete — directly in the sheets, or by continuing the conversation with the AI Modeller.
Model it
When the setup data looks right, ask the AI Modeller to model it — e.g. “Model the business” or name the revenue and expense lines you want built first.
The AI fills in drivers, rates, and mapping, then generates preliminary output and financial statements from that data.
Step 3 — Review your output
After modelling, check these sheets:
-
Prelim Output — how each line is calculated
(
Driver × Unit Rate × (1 + Economic Parameter)) - PrelimCashOutput — cash timing from payment terms
- Income Statement — P&L by period
- Cashflow Statement — cash movements
- Balance Sheet — assets, liabilities, equity
Use How to use & Tips in the workbook for guidance and suggested line items. Confirm totals tie and you can explain the numbers to someone else.
Step 4 — Refine and keep outputs up to date
You will often need to change assumptions or add new items after the first model run.
Make changes
- In Excel — edit values on Drivers, Rates, Mapping, EconomicParam, or other input sheets.
- In AI Modeller — describe new revenue or expense lines, or ask the AI to update existing ones.
Get the latest output
Whenever you change a value manually in the workbook, press Refresh values in the sidebar (or the refresh button when the sidebar is minimised).
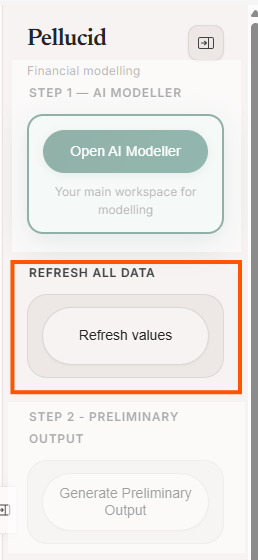
Refresh regenerates preliminary output and financial statements from your current data — you do not need to run each step separately after every edit.
Quick reference
Open Pellucid in Excel
    ↓
Step 2: Conversation with AI Modeller → data written to workbook
    ↓
Review and adjust Drivers, Rates, Mapping, ModelSetupDetails, etc.
    ↓
Ask AI Modeller to model it
    ↓
Review Prelim Output and financial statements
    ↓
Edit sheets or add items via AI Modeller → Refresh values → review again
Workbook sheets at a glance
| Category | Sheets |
|---|---|
| Setup | ModelSetupDetails, How to use & Tips, ConvHistory |
| Inputs | Drivers, Rates, Mapping, EconomicParam, Payment Terms Distribution |
| Forecast | Prelim Output, PrelimCashOutput |
| Statements | Income Statement, Balance Sheet, Cashflow Statement |
| Other | OpeningBalance |
Other utilities
| Action | When to use it |
|---|---|
| Manual setup (form) | Alternative to setup chat — enter Break Forecast by, periods, start date, currency, and business overview in a form |
| Model Business Activity | Add a business activity manually without chat |
| Add Economic Parameter | Add inflation/growth columns |
| Highlight Formulas | Inspect formula structure on the active sheet |
| Remove duplicates from Mapping | Clean duplicate mapping rows |
Note: The manual setup form lists AUD, USD, EUR, GBP, and INR in its dropdown. In AI Modeller chat, you can use any reporting currency.
Get help
Questions or access issues: see Support or email admin@8bits.company. For policies, read the Privacy Policy and Terms of Use.